Fibonacci retracement is a tool that often intimidates beginners due to its mathematical origins but the practical application is actually quite straightforward once you understand the core concept. This guide explains exactly what this tool means and how traders apply it.
What Is Fibonacci Retracement
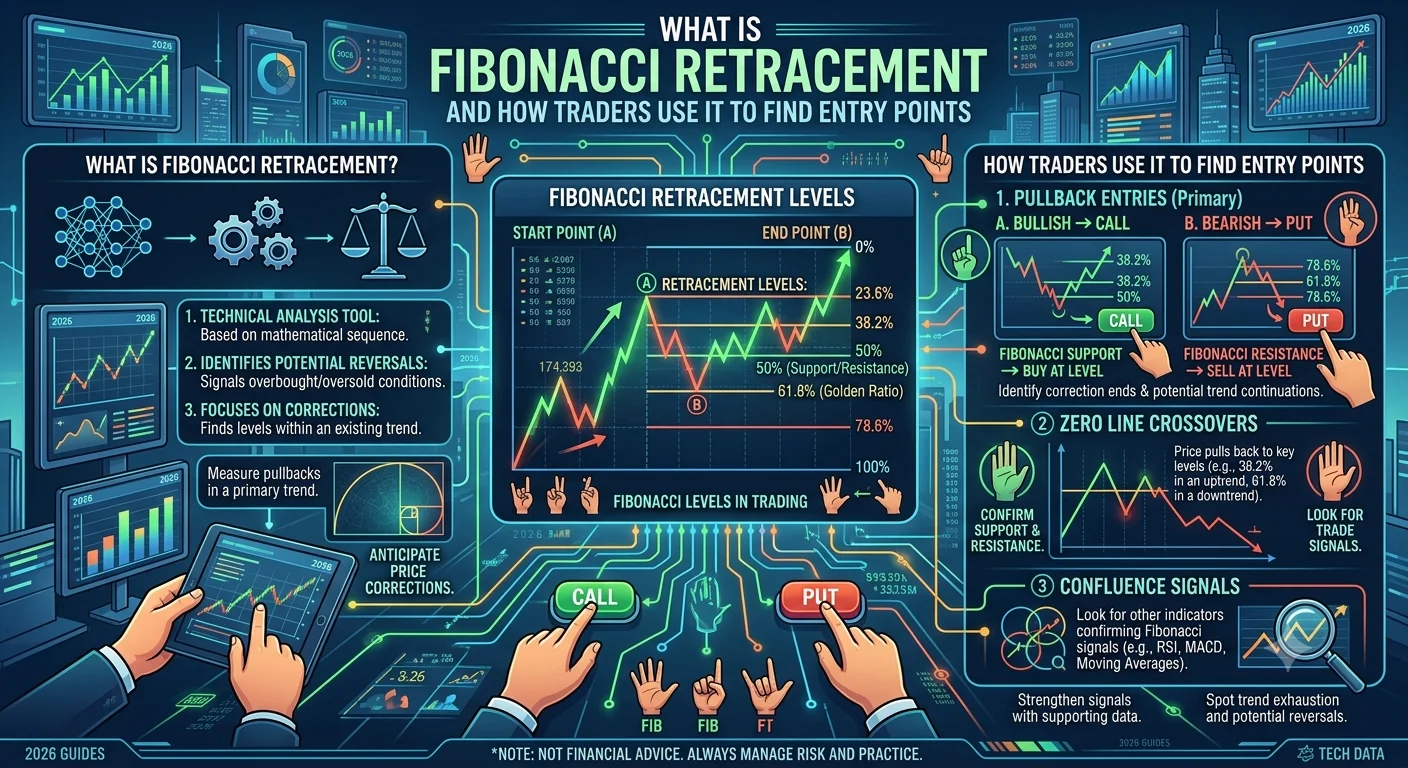
Fibonacci retracement is a technical analysis tool based on a specific mathematical sequence that traders use to identify potential support and resistance levels during a price pullback within an established trend. The tool plots several horizontal lines on your chart at specific percentage levels between a recent significant high and low price point.
The most commonly used Fibonacci levels include twenty three point six percent thirty eight point two percent fifty percent sixty one point eight percent and seventy eight point six percent. These specific percentages are derived from a mathematical sequence that appears frequently throughout nature and has been adapted for use in financial market analysis.
Why Fibonacci Levels Are Believed to Matter
- What Is Fibonacci Retracement
- Why Fibonacci Levels Are Believed to Matter
- How to Apply Fibonacci Retracement to a Chart
- Using Fibonacci Levels for Binary Options Entries
- Why Combining Fibonacci With Other Tools Improves Reliability
- Common Mistakes Beginners Make With Fibonacci Retracement
- How to Practice Using Fibonacci Retracement
- Frequently Asked Questions About Fibonacci Retracement
Many traders believe that after a significant price movement the market often pulls back or retraces a portion of that movement before potentially continuing in the original direction. Fibonacci retracement levels are used to identify where this pullback might pause or reverse based on these specific mathematical percentages.
While there is ongoing debate about why these particular levels seem to show relevance in price behavior many traders have observed price reactions occurring at or near these calculated levels frequently enough to incorporate this tool into their broader analysis.
How to Apply Fibonacci Retracement to a Chart
To apply this tool you identify a significant recent price swing either from a low point to a high point during an uptrend or from a high point to a low point during a downtrend. Most charting platforms include a Fibonacci retracement tool that automatically calculates and displays the relevant percentage levels once you select these two points.
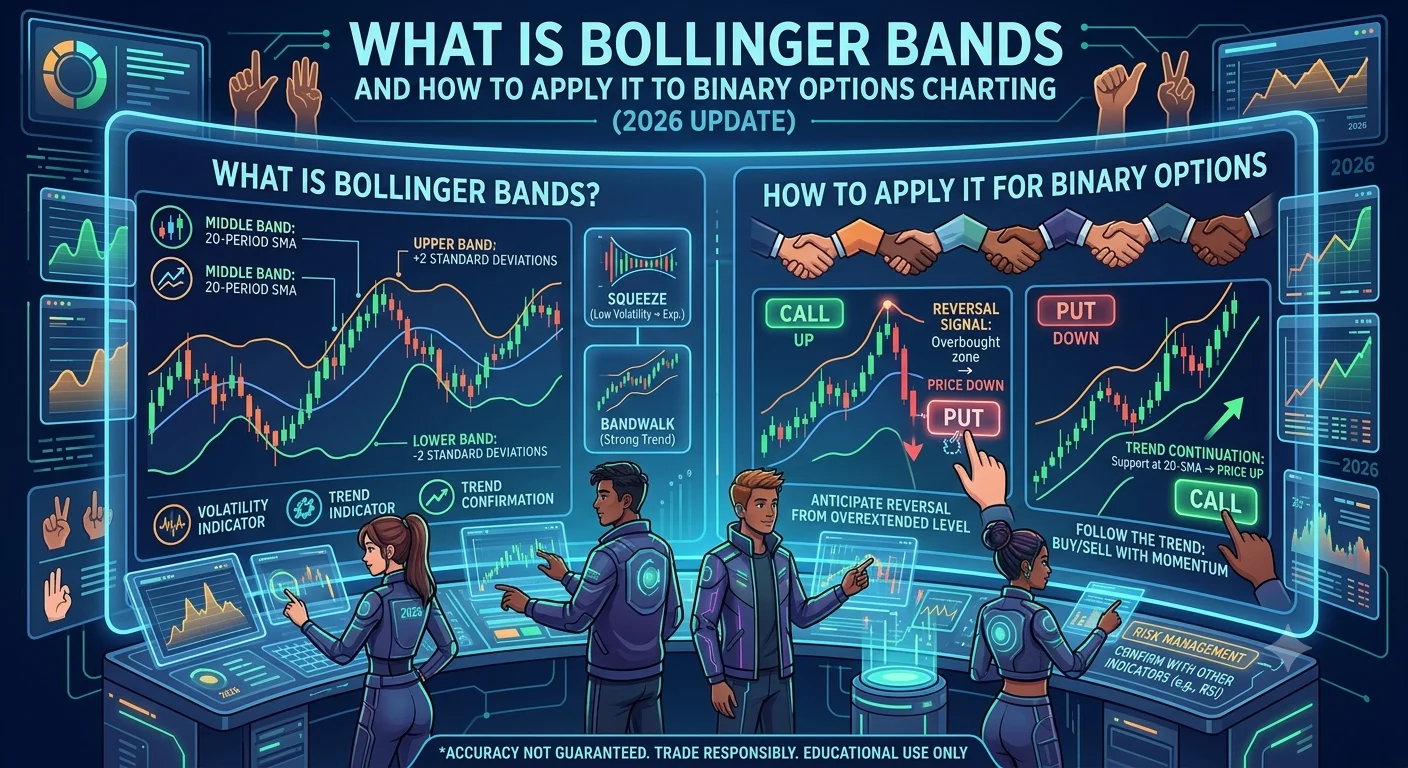
- What Is Bollinger Bands and How to Apply It to Binary Options Charting
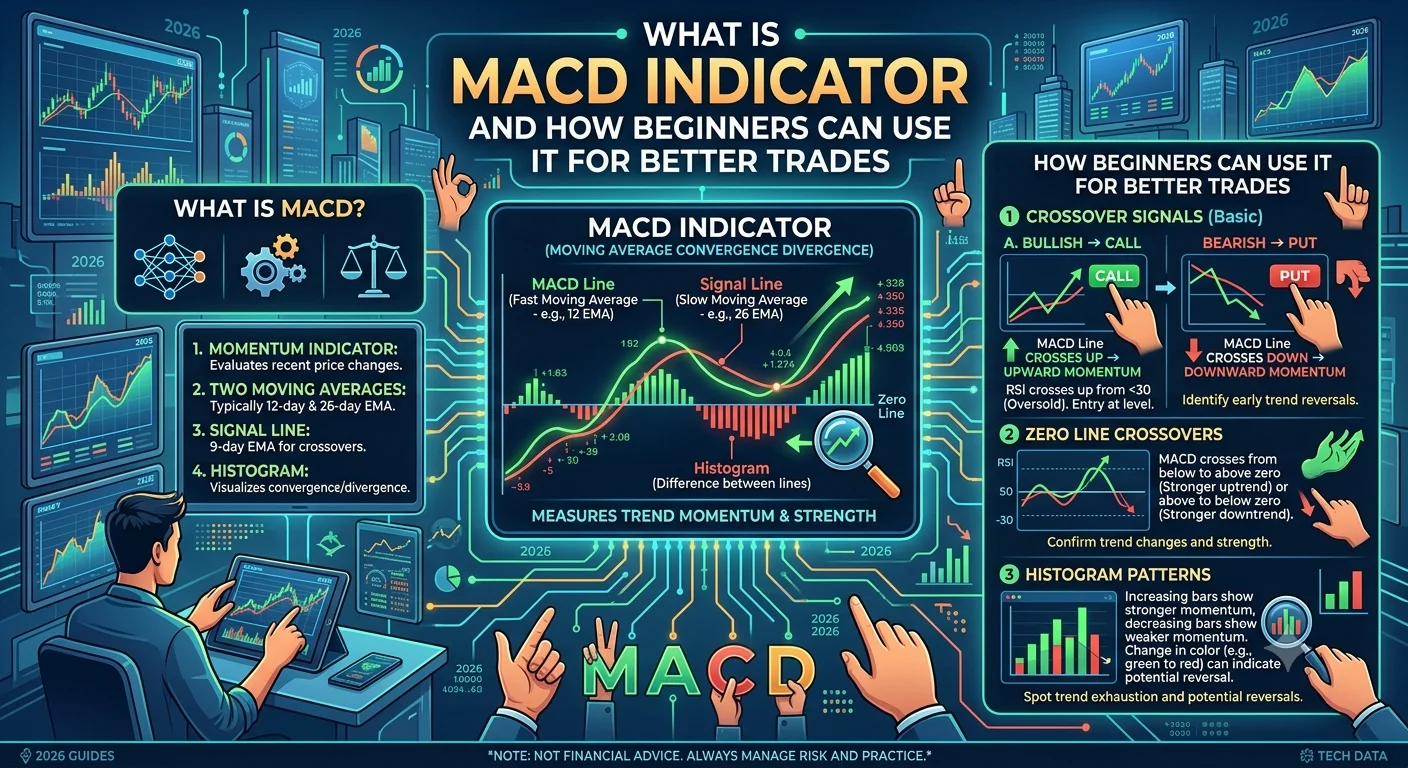
- What Is MACD Indicator and How Beginners Can Use It for Better Trades
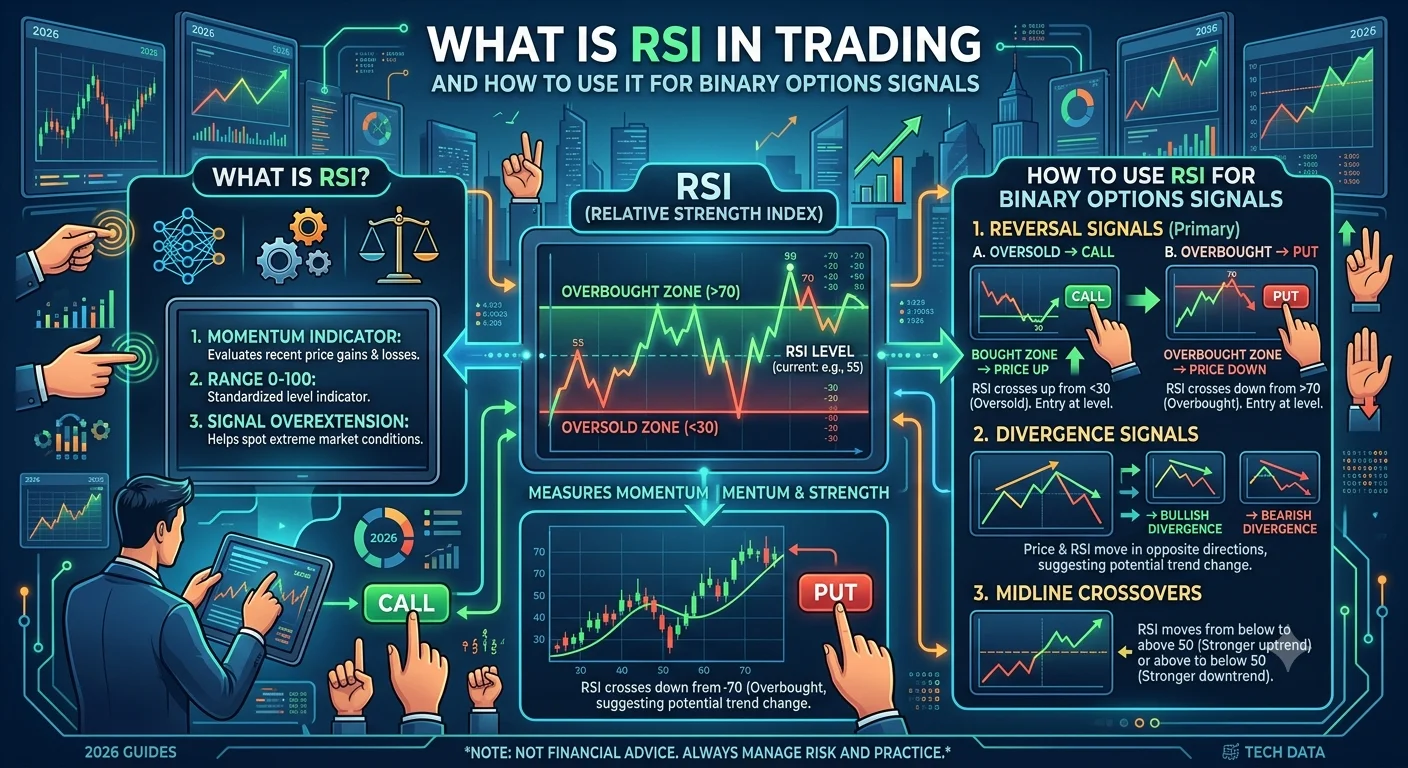
- What Is RSI in Trading and How to Use It for Binary Options Signals
Once plotted these levels appear as horizontal lines across your chart and you can observe how price behaves as it approaches each specific level during a pullback.
Using Fibonacci Levels for Binary Options Entries
During an uptrend if price pulls back toward one of the Fibonacci levels such as the fifty percent or sixty one point eight percent level and shows signs of finding support at that level through candlestick patterns or other confirmation some traders consider this a potential opportunity for a call option anticipating the uptrend resuming.
During a downtrend the same principle applies in reverse where a pullback toward a Fibonacci level showing resistance could be considered a potential opportunity for a put option anticipating the downtrend resuming.
Recommended Articles
 STRATEGIES
 STRATEGIES
 STRATEGIES
 STRATEGIES
Why Combining Fibonacci With Other Tools Improves Reliability
Fibonacci levels work best when combined with additional confirmation rather than being used as a standalone signal. For example a Fibonacci level that aligns closely with a previously established support or resistance level identified through other methods carries more combined significance than a Fibonacci level alone.
Similarly watching for specific candlestick patterns such as a hammer or engulfing pattern forming exactly at a Fibonacci level provides additional supporting evidence before considering a trade based on this tool.
Common Mistakes Beginners Make With Fibonacci Retracement
One common mistake is selecting an inappropriate or insignificant price swing when applying the tool which results in Fibonacci levels that do not carry meaningful relevance to actual market behavior. Choosing a clear significant recent high and low point is important for generating useful levels.
Another common mistake is expecting price to react perfectly at every single Fibonacci level every time which is unrealistic. Like other technical analysis tools Fibonacci retracement improves the probability of identifying a meaningful level but does not guarantee a reaction will occur at any specific point.
How to Practice Using Fibonacci Retracement
Spend time on a demo account specifically practicing how to select appropriate price swings and observing how price behaves as it approaches different Fibonacci levels across various market conditions. This practice helps build familiarity with how reliable this tool tends to be for your specific chosen assets before applying it to live trading decisions.
Frequently Asked Questions About Fibonacci Retracement
What is Fibonacci retracement used for in trading Fibonacci retracement is used to identify potential support and resistance levels during a price pullback within an established trend based on specific mathematical percentage levels.
What are the most commonly used Fibonacci levels The most commonly used levels include twenty three point six percent thirty eight point two percent fifty percent sixty one point eight percent and seventy eight point six percent.
Does price always reverse at a Fibonacci level No. Fibonacci retracement improves the probability of identifying a meaningful level but does not guarantee a price reaction will occur at any specific point every single time.
Should I use Fibonacci retracement alone to make trading decisions No. Combining Fibonacci levels with other confirmation such as candlestick patterns or previously established support and resistance levels generally produces more reliable trading decisions.
Is Fibonacci retracement difficult to learn for beginners While the mathematical origin may seem complex the practical application is straightforward since most charting platforms automatically calculate and display the levels once you select the relevant price swing.
Many of these technical tools become even more effective within a structured strategy framework. Continue learning with our guide explaining what the Martingale strategy is in binary options and whether you should use it.
This article is for educational purposes only and does not constitute financial advice. Trading involves risk and you should only invest money you can afford to lose.