RSI is one of the most widely used technical indicators in trading and for good reason. It provides a simple way to measure momentum and identify potential reversal points without requiring complicated calculations on your part.
This guide explains exactly what RSI means and how binary options traders can use it effectively.
What Is RSI
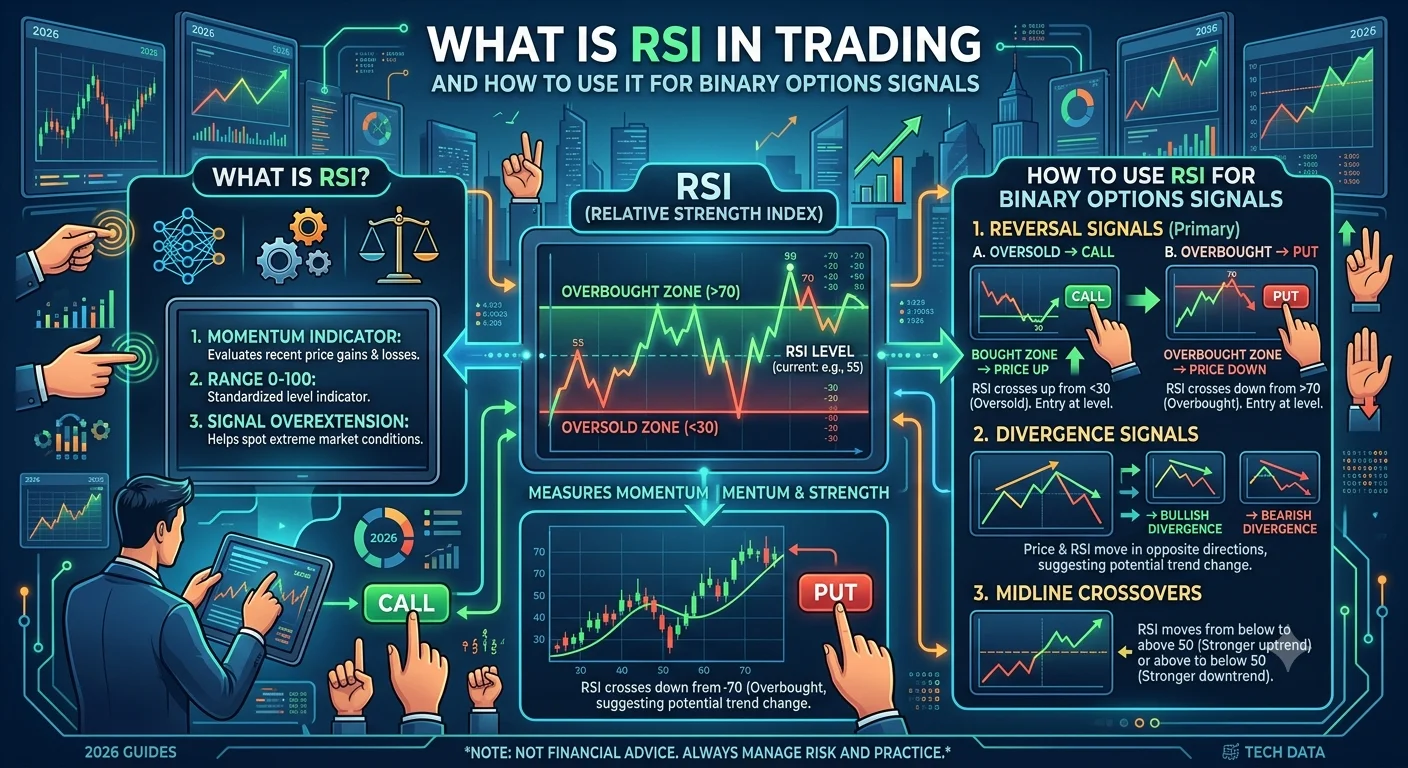
RSI stands for Relative Strength Index. It is a momentum indicator that measures the speed and size of recent price changes to evaluate whether an asset is currently overbought or oversold.
RSI is displayed as a single line that moves between zero and one hundred on a separate panel below your main price chart. This number helps traders quickly assess current market momentum at a glance without needing to manually analyze recent price action in detail.
How to Read RSI Values
When RSI rises above seventy this generally suggests the asset may be overbought meaning the recent price increase may have moved further or faster than typical and could be due for a pullback or reversal.
When RSI falls below thirty this generally suggests the asset may be oversold meaning the recent price decline may have moved further or faster than typical and could be due for a bounce or reversal upward.
RSI readings between thirty and seventy are generally considered neutral territory without a strong overbought or oversold signal present.
How RSI Can Signal Potential Binary Options Trades
Many traders watch for RSI to cross above seventy and then begin declining back below this level as a potential signal to consider a put option anticipating a downward reversal. Similarly many traders watch for RSI to cross below thirty and then begin rising back above this level as a potential signal to consider a call option anticipating an upward reversal.
This approach attempts to capture reversal points after a period of strong directional momentum that may be losing strength based on the RSI reading.
Why RSI Should Not Be Used in Isolation
While RSI provides valuable information about momentum it should not be your only basis for placing a trade. During strong sustained trends an asset can remain in overbought or oversold territory for extended periods without immediately reversing which can lead to premature trades if you rely on RSI signals alone.
- How to Use Economic News and Events to Make Better Binary Options Trades
- Best Free Binary Options Trading Signals Tools and Apps in 2026
- What Are Binary Options Trading Signals and How Do You Use Them Correctly
Combining RSI with trend analysis support and resistance levels or candlestick pattern confirmation generally produces more reliable trading decisions than using RSI in isolation.
Using RSI Alongside Trend Direction
A common approach involves checking the overall trend direction before acting on an RSI signal. If the broader trend is clearly upward an oversold RSI reading suggesting a call option aligns with the trend and may carry more weight than an overbought RSI reading suggesting a put option which would be trading against the established trend.
Recommended Articles
 STRATEGIES
 STRATEGIES
 STRATEGIES
 STRATEGIES
This combination helps filter out potentially weaker RSI signals that contradict the dominant market direction.
Common RSI Settings Used by Traders
The standard RSI setting most commonly used calculates momentum based on the previous fourteen periods though some traders adjust this number depending on their preferred trading style and chosen expiry time.
Shorter period settings make RSI more sensitive and responsive to recent price changes while longer period settings produce smoother readings that may filter out some of the minor short term fluctuations. Beginners often start with the standard fourteen period setting before experimenting with adjustments as they gain experience.
Common Mistakes Beginners Make With RSI
One common mistake is assuming every overbought or oversold reading will immediately result in a reversal which is not always the case especially during strong trending markets. Another common mistake is ignoring the broader trend context and trading every RSI signal regardless of whether it aligns with or contradicts the dominant market direction.
Beginners should also avoid using RSI as their only indicator and instead combine it with other tools discussed throughout our trading education content for more reliable confirmation before placing trades.
Frequently Asked Questions About RSI
What does RSI stand for RSI stands for Relative Strength Index. It is a momentum indicator used to measure whether an asset may be overbought or oversold based on recent price movement.
What RSI level indicates an asset is overbought An RSI reading above seventy generally indicates an asset may be overbought though this does not guarantee an immediate reversal will occur.
What RSI level indicates an asset is oversold An RSI reading below thirty generally indicates an asset may be oversold though this does not guarantee an immediate reversal will occur.
Should I use RSI alone to make trading decisions No. RSI works best when combined with other tools such as trend analysis support and resistance levels or candlestick pattern confirmation rather than being used in isolation.
Can RSI remain overbought or oversold for a long time Yes. During strong sustained trends RSI can remain in overbought or oversold territory for extended periods without an immediate reversal which is why combining it with trend analysis is important.
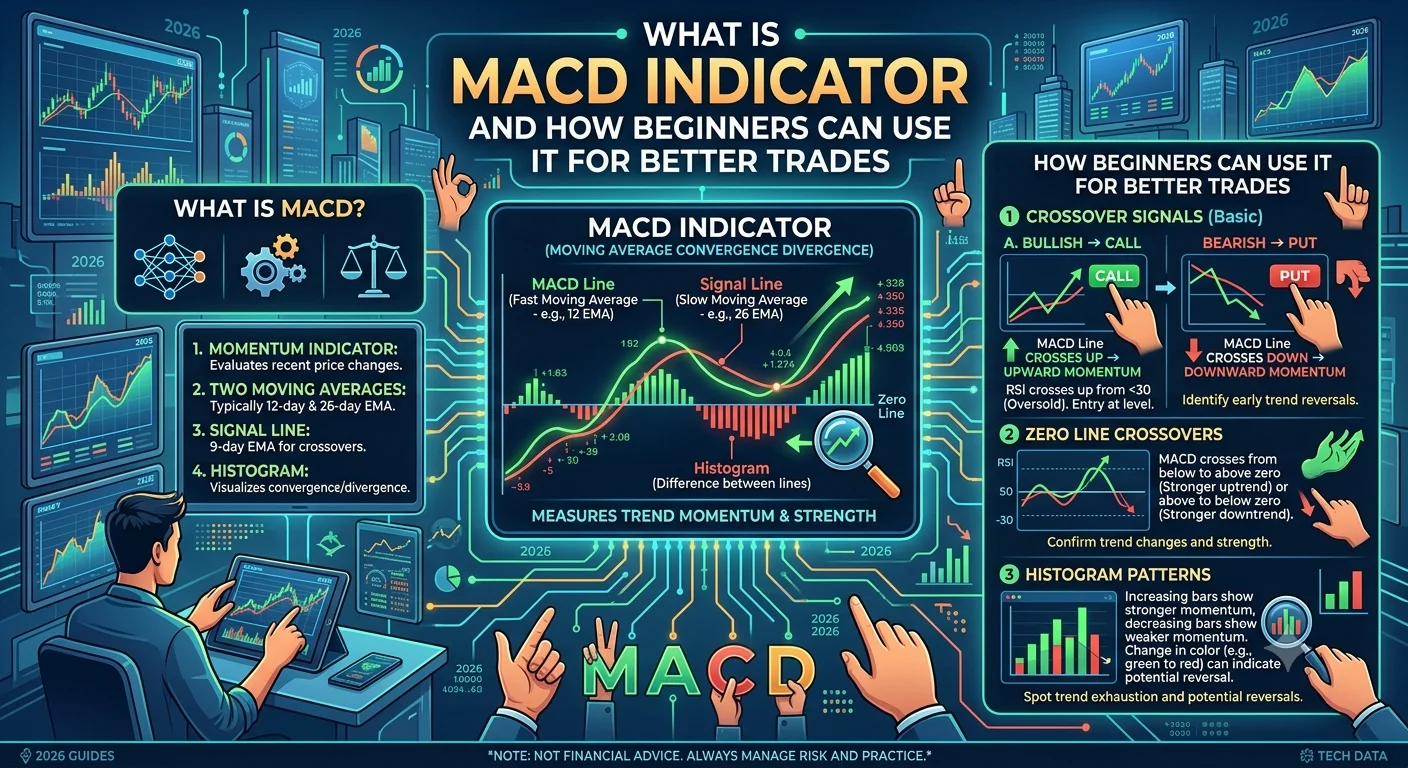
RSI works well alongside other momentum based indicators. Continue learning with our guide explaining what the MACD indicator is and how beginners can use it for better trades.
This article is for educational purposes only and does not constitute financial advice. Trading involves risk and you should only invest money you can afford to lose.