Technical analysis is the foundation that separates traders who guess from traders who make informed decisions. Understanding this single concept opens the door to nearly every strategy and indicator used in binary options trading today.
This guide explains exactly what technical analysis means and why it matters so much for your trading success.
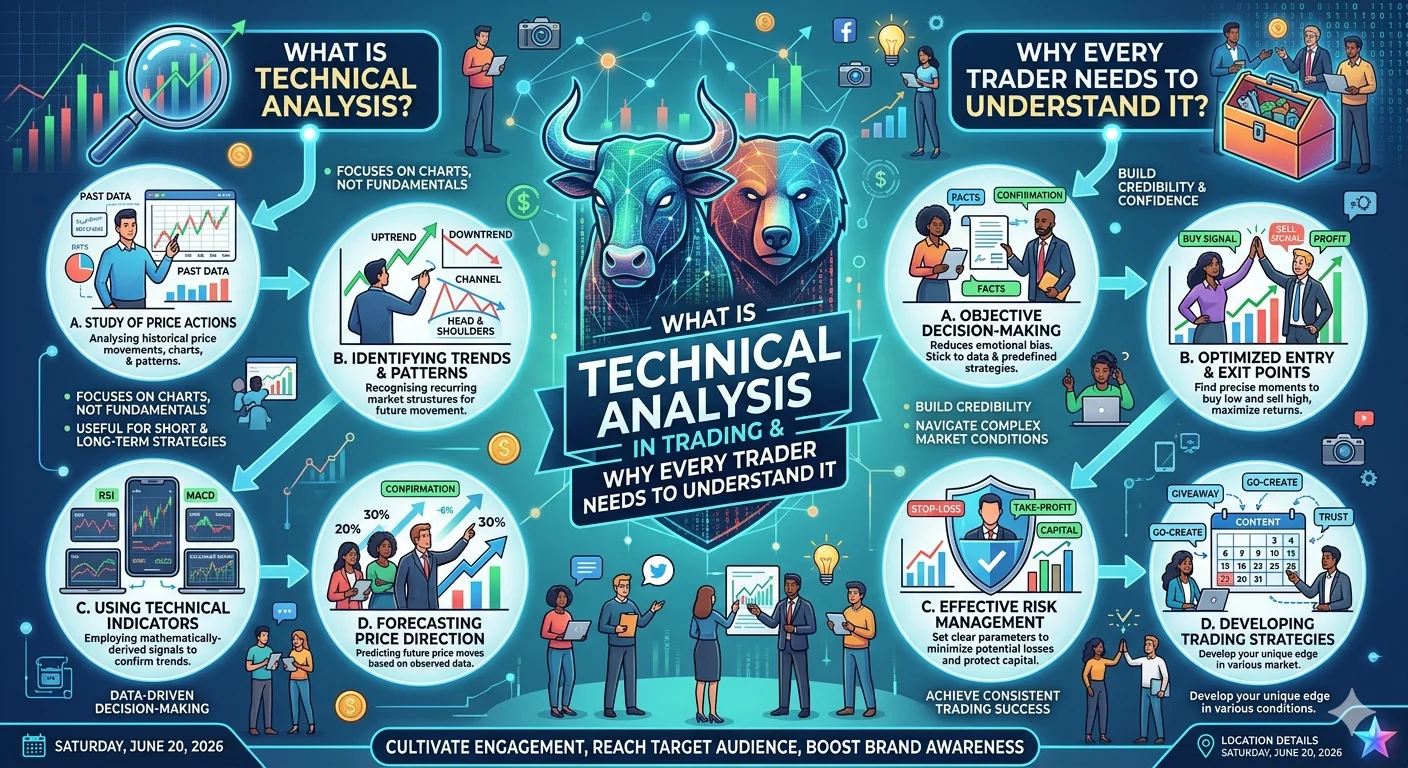
What Is Technical Analysis
Technical analysis is the practice of studying past price movement and trading volume to predict future price direction. Instead of looking at a company's financial health or broader economic conditions technical analysis focuses entirely on the price chart itself.
The core idea behind technical analysis is that price movement tends to follow patterns and trends that repeat over time due to the collective behavior of traders reacting to similar market conditions. By recognizing these patterns traders attempt to predict where the price is likely to move next.
Why Technical Analysis Matters for Binary Options Trading
- What Is Technical Analysis
- Why Technical Analysis Matters for Binary Options Trading
- The Three Core Components of Technical Analysis
- Price Charts
- Trend Identification
- Technical Indicators
- Support and Resistance as a Core Technical Analysis Concept
- How Beginners Should Start Learning Technical Analysis
- Common Mistakes Beginners Make With Technical Analysis
- Does Technical Analysis Actually Work
- Frequently Asked Questions About Technical Analysis
Since binary options trading requires predicting price direction within a fixed time period technical analysis provides the tools needed to make that prediction based on evidence rather than guessing. Without it traders are essentially flipping a coin on every trade.
Learning technical analysis allows you to identify trends before they fully develop recognize potential reversal points and time your entries more effectively. This skill directly impacts your consistency and long term results far more than luck ever could.
The Three Core Components of Technical Analysis
Price Charts
Price charts visually display how an asset's price has moved over a specific period of time. The most common chart type used in binary options trading is the candlestick chart which shows the open high low and close price for each time interval.
Learning to read candlestick charts is typically the first step every trader takes when learning technical analysis since nearly every other tool builds upon this foundation.
Trend Identification
A trend describes the general direction an asset's price is moving whether upward downward or sideways. Identifying the current trend is often considered the single most important skill in technical analysis since trading in the direction of an established trend generally produces more consistent results than trading against it.
Technical Indicators
Technical indicators are mathematical calculations based on price and volume data that help traders identify potential entry and exit points. Common indicators include moving averages which smooth out price data the relative strength index which measures momentum and Bollinger Bands which measure volatility.
These indicators do not predict the future with certainty but they provide additional context that supports more informed trading decisions.
Support and Resistance as a Core Technical Analysis Concept
Support and resistance levels represent price points where an asset has historically struggled to move beyond. Support represents a price floor where buying pressure has previously stopped a decline while resistance represents a price ceiling where selling pressure has previously stopped a rise.
Recommended Articles
 STRATEGIES
 STRATEGIES
 STRATEGIES
Many trading strategies are built around identifying these levels and predicting how price will react when it approaches them again in the future.
How Beginners Should Start Learning Technical Analysis
Start by learning to read basic candlestick patterns since this forms the visual foundation for everything else. Next focus on identifying trend direction using simple tools such as moving averages. Once comfortable with these basics gradually introduce one or two additional indicators rather than overwhelming yourself with too many tools at once.
Many successful traders use a relatively simple combination of just a few tools applied consistently rather than constantly switching between dozens of different indicators.
Common Mistakes Beginners Make With Technical Analysis
One common mistake is relying on too many indicators simultaneously which often produces conflicting signals and creates confusion rather than clarity. Another common mistake is ignoring the broader trend and focusing only on short term price movements which can lead to trading against the overall market direction.
Beginners also frequently expect technical analysis to provide guaranteed accurate predictions. In reality technical analysis improves the probability of making correct predictions over time but it does not eliminate uncertainty entirely.
Does Technical Analysis Actually Work
Technical analysis works because financial markets are influenced by the collective psychology of traders who often react similarly to similar chart patterns creating somewhat predictable behavior over time. However this does not mean technical analysis guarantees success on every individual trade.
The real value of technical analysis comes from improving your decision making consistency over a large number of trades rather than guaranteeing any single outcome. Traders who apply technical analysis disciplined over time generally perform more consistently than those who trade based on emotion or random guessing.
Frequently Asked Questions About Technical Analysis
What is the easiest part of technical analysis for beginners to learn first Most beginners start by learning basic candlestick chart reading since this provides the visual foundation needed before learning more advanced indicators and concepts.
Do I need to use every technical indicator available to be successful No. Many successful traders use only a small number of indicators consistently rather than overwhelming their analysis with too many conflicting tools.
Is technical analysis guaranteed to predict price movement correctly No. Technical analysis improves the probability of making informed predictions but does not guarantee any individual trade outcome since markets remain inherently unpredictable.
How long does it take to learn technical analysis This varies by individual but most traders spend several weeks to a few months learning the fundamentals before feeling confident applying technical analysis to live trades.
Can technical analysis be used for assets other than binary options Yes. Technical analysis is widely used across forex stock trading cryptocurrency trading and many other financial markets in addition to binary options.
Now that you understand what technical analysis means continue building your skills with our guide on how to read candlestick charts for binary options trading with clear visual examples.
This article is for educational purposes only and does not constitute financial advice. Trading involves risk and you should only invest money you can afford to lose.