Bollinger Bands provide a visual way to measure volatility directly on your price chart making them one of the more intuitive indicators for beginners to understand once explained clearly. This guide breaks down exactly how this tool works and how to apply it to your trading.
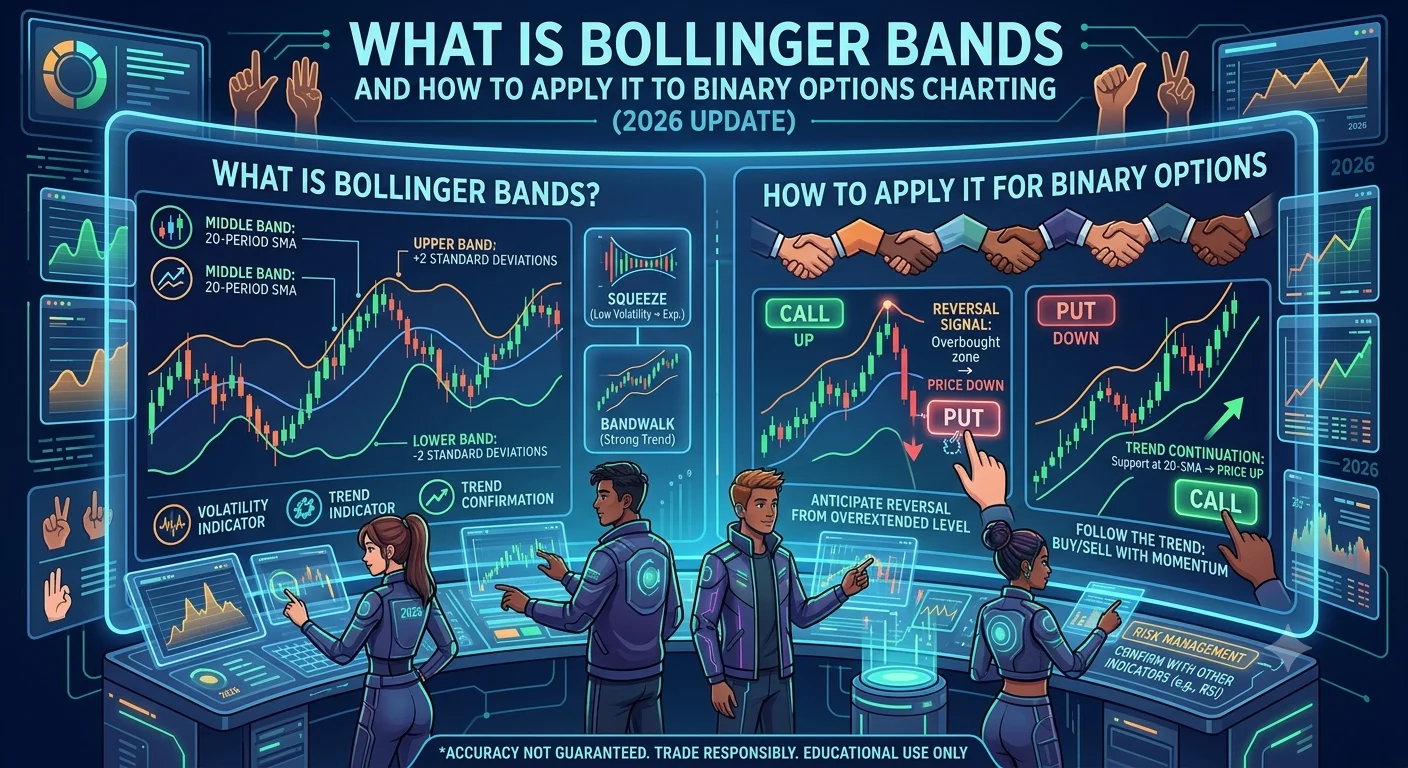
What Are Bollinger Bands
Bollinger Bands consist of three lines plotted directly on your price chart. A middle line which is typically a simple moving average. An upper band which sits a certain distance above the middle line based on recent price volatility. A lower band which sits the same distance below the middle line.
As volatility increases the bands widen apart from each other. As volatility decreases the bands narrow closer together. This visual expansion and contraction provides an immediate sense of current market volatility simply by observing how wide or narrow the bands currently appear.
How Bollinger Bands Help Identify Potential Reversals
- What Are Bollinger Bands
- How Bollinger Bands Help Identify Potential Reversals
- How Bollinger Band Width Indicates Market Conditions
- Using Bollinger Bands to Identify Breakouts
- Why Context Matters When Using Bollinger Bands
- Common Settings Used for Bollinger Bands
- Common Mistakes Beginners Make With Bollinger Bands
- Frequently Asked Questions About Bollinger Bands
When price touches or moves outside the upper band this can suggest the asset may be relatively overbought in the short term which some traders interpret as a potential signal to consider a put option anticipating a pullback back toward the middle line.
When price touches or moves outside the lower band this can suggest the asset may be relatively oversold in the short term which some traders interpret as a potential signal to consider a call option anticipating a bounce back toward the middle line.
This approach treats the bands somewhat similarly to dynamic support and resistance levels that adjust automatically based on current volatility conditions.
How Bollinger Band Width Indicates Market Conditions
When the bands are narrow and close together this often indicates a period of low volatility sometimes referred to as a squeeze. These quiet periods can sometimes precede a significant breakout in either direction as volatility eventually increases again after a period of consolidation.
When the bands are wide apart this indicates a period of high volatility which often occurs during strong trending movements or immediately following significant news events that caused rapid price changes.
Using Bollinger Bands to Identify Breakouts
Some traders watch specifically for periods of narrow bands followed by a sudden expansion as a signal that a significant price breakout may be occurring. When price breaks strongly beyond either band following a period of narrow consolidation this can sometimes indicate the beginning of a new sustained trend rather than a simple reversal back toward the middle line.
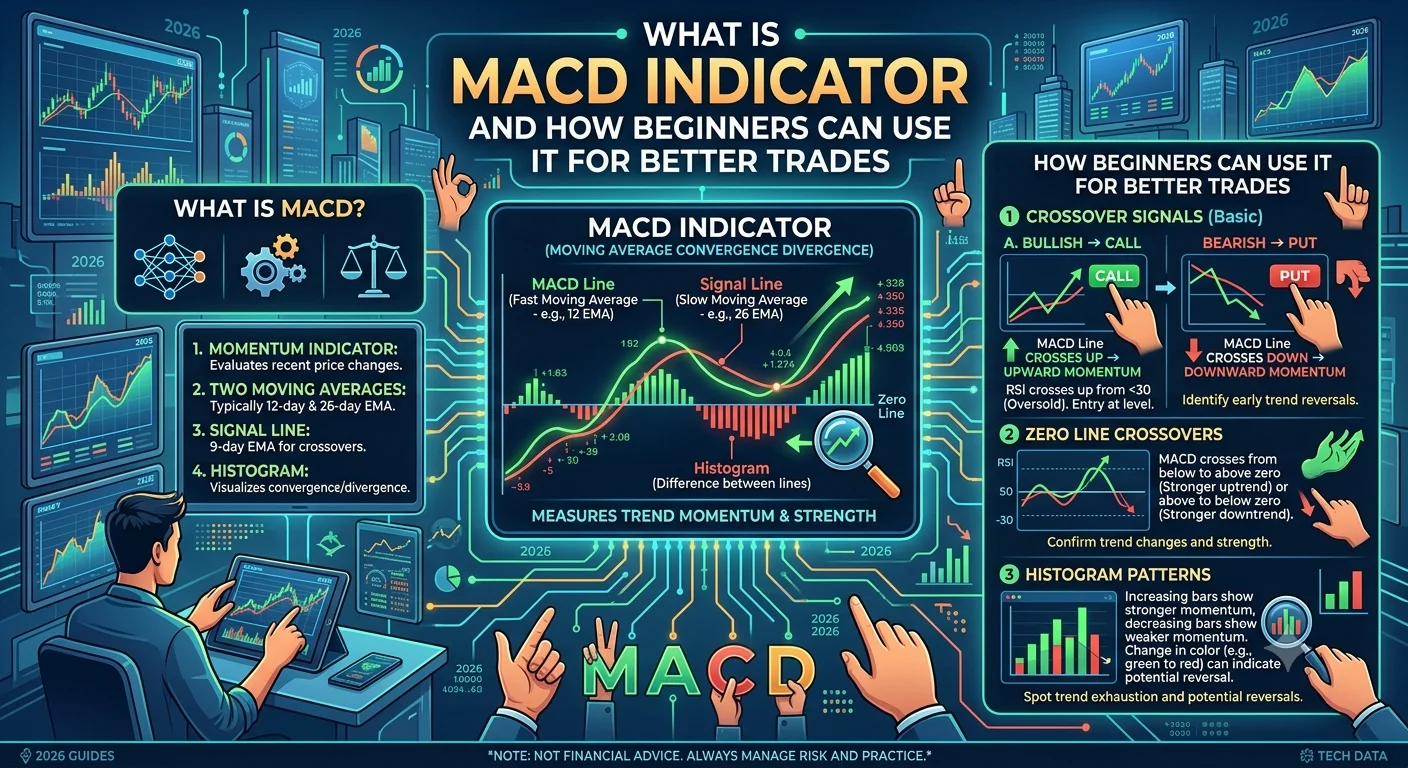
- What Is MACD Indicator and How Beginners Can Use It for Better Trades
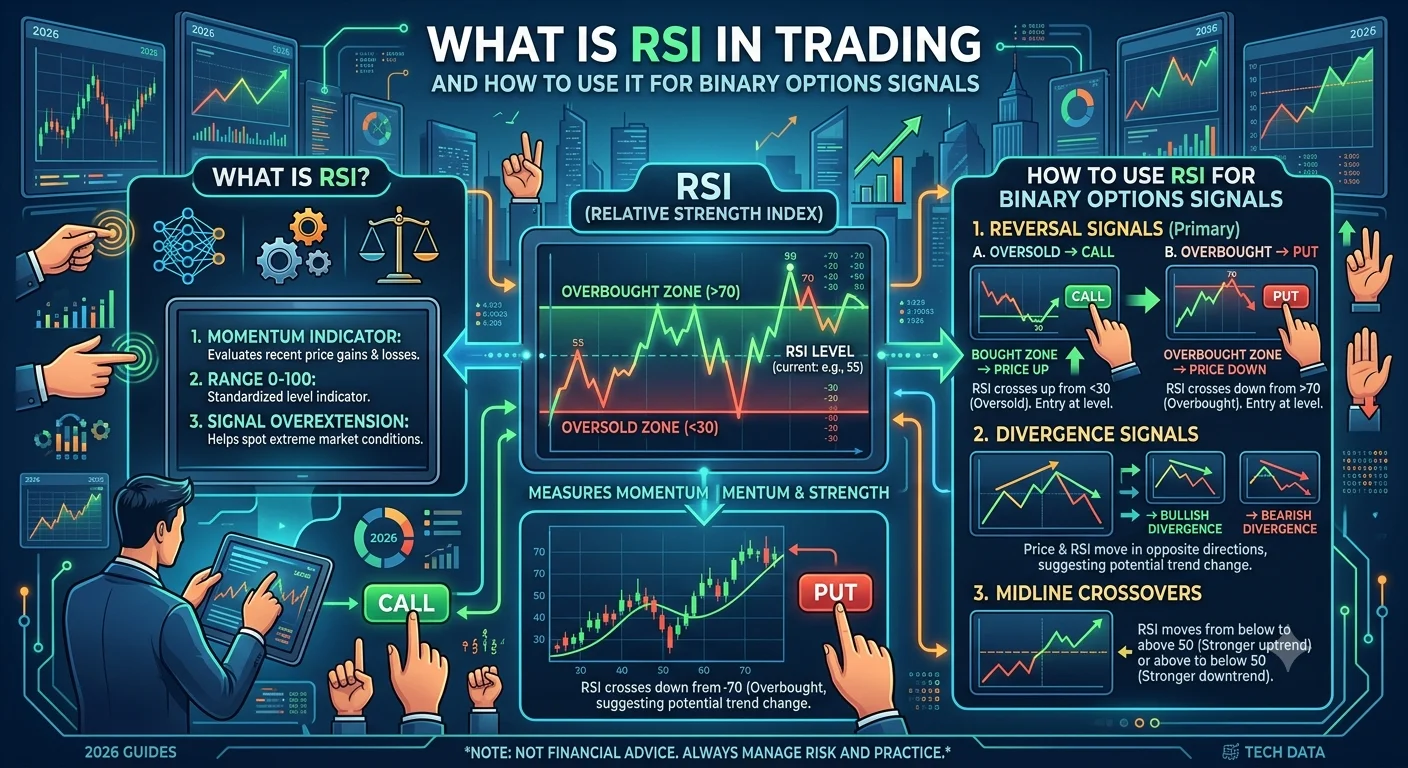
- What Is RSI in Trading and How to Use It for Binary Options Signals
- How to Use Economic News and Events to Make Better Binary Options Trades
This breakout based approach differs from the reversal based approach discussed earlier and traders should be clear about which specific strategy they are applying when using Bollinger Bands for analysis.
Recommended Articles
 STRATEGIES
 STRATEGIES
 STRATEGIES
 STRATEGIES
Why Context Matters When Using Bollinger Bands
Price touching the upper or lower band does not automatically guarantee a reversal will occur especially during strong trending markets where price can ride along one of the bands for an extended period without immediately reversing. This is similar to the limitation discussed with RSI where overbought or oversold conditions can persist longer than expected during strong trends.
Combining Bollinger Band signals with broader trend analysis or candlestick pattern confirmation helps reduce the risk of premature trades based on band touches alone during strong directional movements.
Common Settings Used for Bollinger Bands
The standard Bollinger Band setting typically uses a twenty period moving average for the middle line with the upper and lower bands set at a standard distance based on recent price volatility calculations. Some traders adjust these settings depending on their preferred trading style and chosen time frame though the standard setting provides a reasonable starting point for most beginners.
Common Mistakes Beginners Make With Bollinger Bands
One common mistake is assuming every touch of the upper or lower band automatically signals an immediate reversal without considering the broader trend context first. Another common mistake is confusing the reversal based approach with the breakout based approach and applying inconsistent logic when interpreting the same chart pattern.
Beginners should also avoid using Bollinger Bands during extremely choppy sideways markets without additional confirmation since frequent band touches during these conditions can generate excessive and sometimes conflicting signals.
Frequently Asked Questions About Bollinger Bands
What do Bollinger Bands measure Bollinger Bands measure price volatility by plotting an upper and lower band around a moving average that widens during high volatility and narrows during low volatility periods.
Does price touching the upper band always mean a reversal will occur No. During strong trending markets price can continue riding along one of the bands for an extended period without immediately reversing which is why additional confirmation is recommended.
What does it mean when Bollinger Bands become very narrow Narrow bands indicate a period of low volatility sometimes called a squeeze which can sometimes precede a significant price breakout as volatility increases again afterward.
Should I use Bollinger Bands for reversal trading or breakout trading Both approaches are valid though they require different interpretations of the same chart pattern. Decide which specific approach you are using and apply it consistently rather than mixing both strategies inconsistently.
Can Bollinger Bands be combined with other indicators Yes. Many traders combine Bollinger Bands with momentum indicators such as RSI for additional confirmation before placing a trade based on a potential reversal signal.
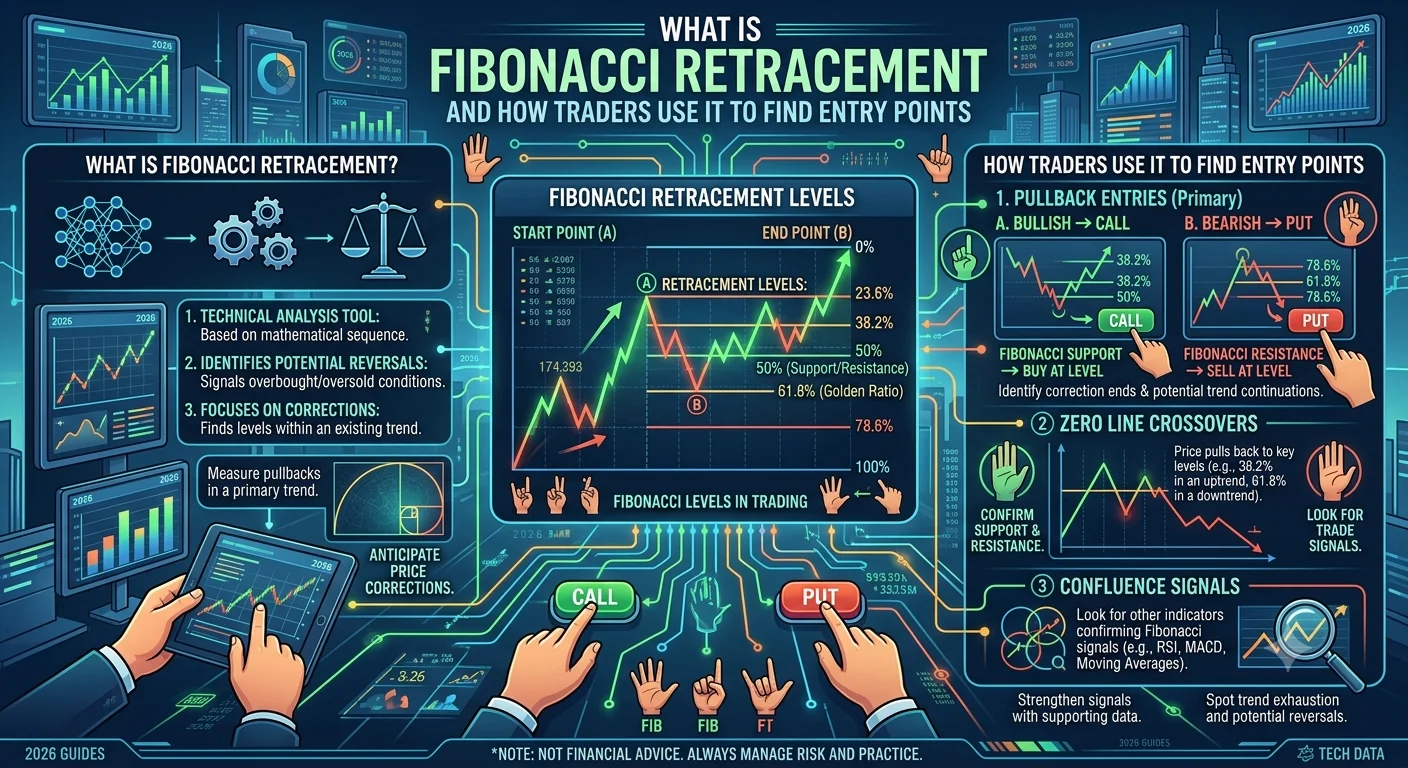
Mathematical retracement tools offer another valuable perspective for identifying potential entry points. Continue learning with our guide explaining what Fibonacci retracement is and how traders use it to find entry points.
This article is for educational purposes only and does not constitute financial advice. Trading involves risk and you should only invest money you can afford to lose.