
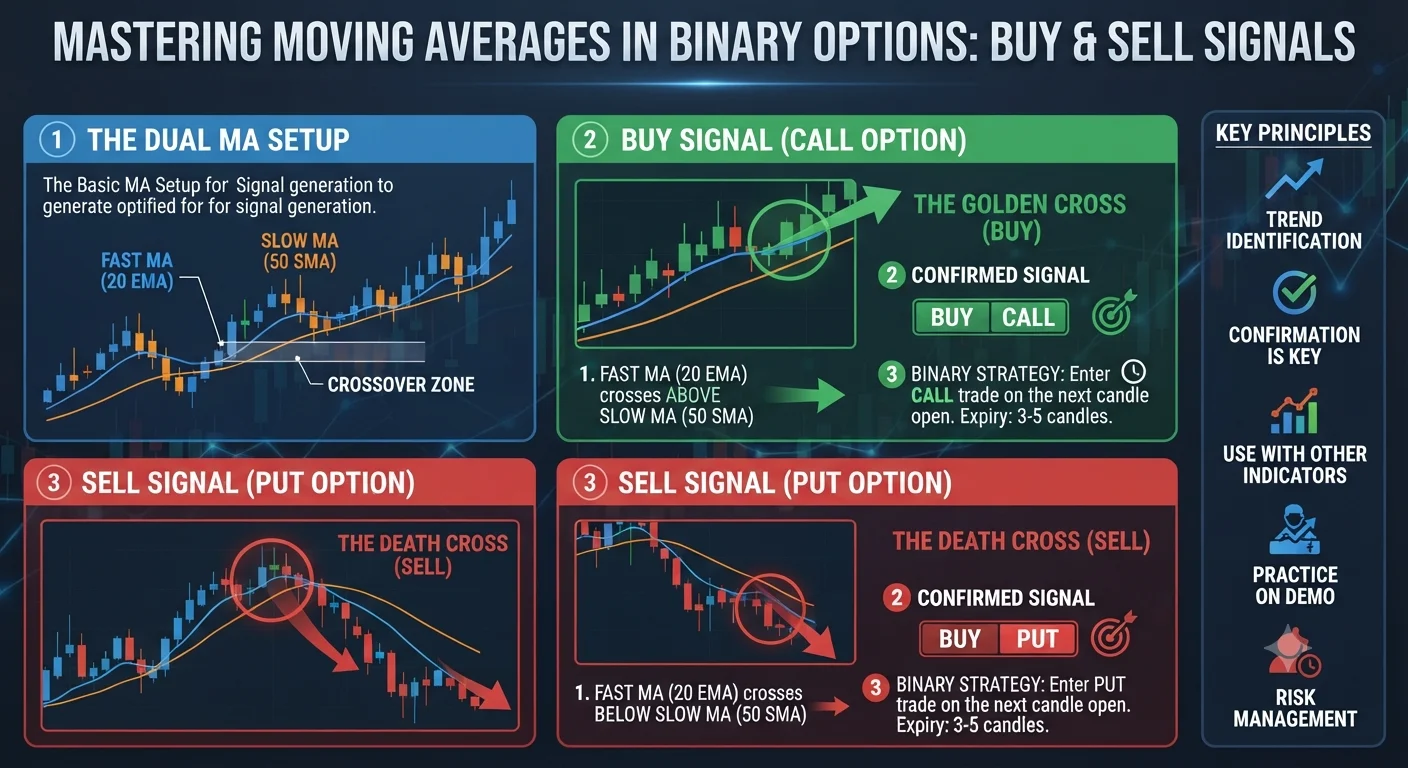
Moving averages are among the most widely used tools in technical analysis and for good reason. They smooth out price data to reveal the underlying trend direction more clearly and generate specific signals that many traders use to time their entries with greater consistency.
This guide explains exactly how moving averages work and how to apply them to your binary options trading.
What Is a Moving Average
A moving average is a technical indicator that calculates the average price of an asset over a specific number of past periods and plots this continuously updated average as a smooth line directly on your price chart. As new price data arrives the oldest data drops off and the average updates accordingly which is why it is called a moving average.
The most common types are the simple moving average which weights all periods equally and the exponential moving average which gives more weight to more recent price data making it slightly more responsive to recent changes in price direction.
How Moving Averages Reveal Trend Direction
- What Is a Moving Average
- How Moving Averages Reveal Trend Direction
- The Moving Average Crossover Signal
- Using Moving Averages as Dynamic Support and Resistance
- Common Moving Average Period Settings
- Limitations of Moving Averages
- How to Combine Moving Averages With Other Tools
- Frequently Asked Questions About Moving Averages
When price is consistently trading above a moving average this generally supports an uptrend reading as the average price over the lookback period is below the current price indicating a general upward trajectory. When price is consistently trading below a moving average this generally supports a downtrend reading.
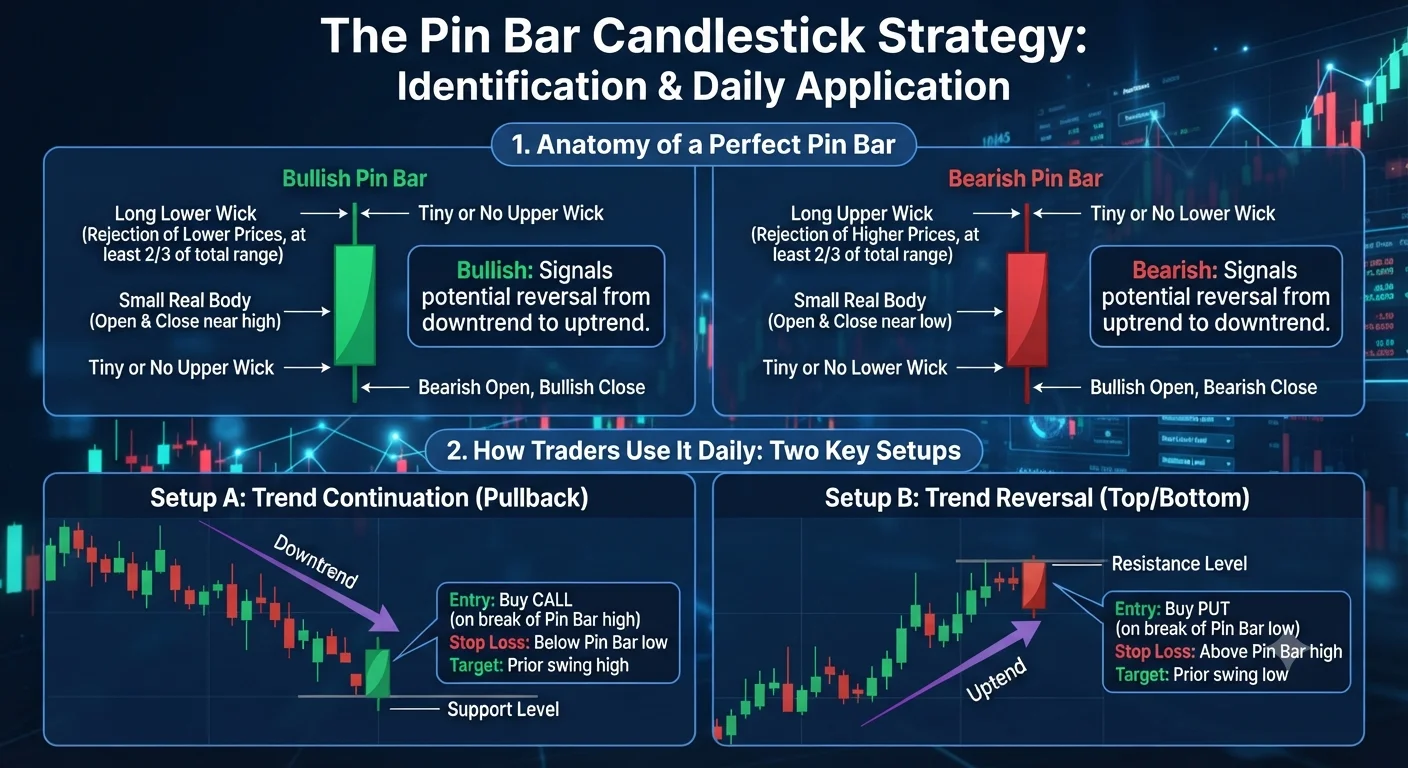
- What Is the Pin Bar Candlestick Strategy and How Traders Use It Every Day
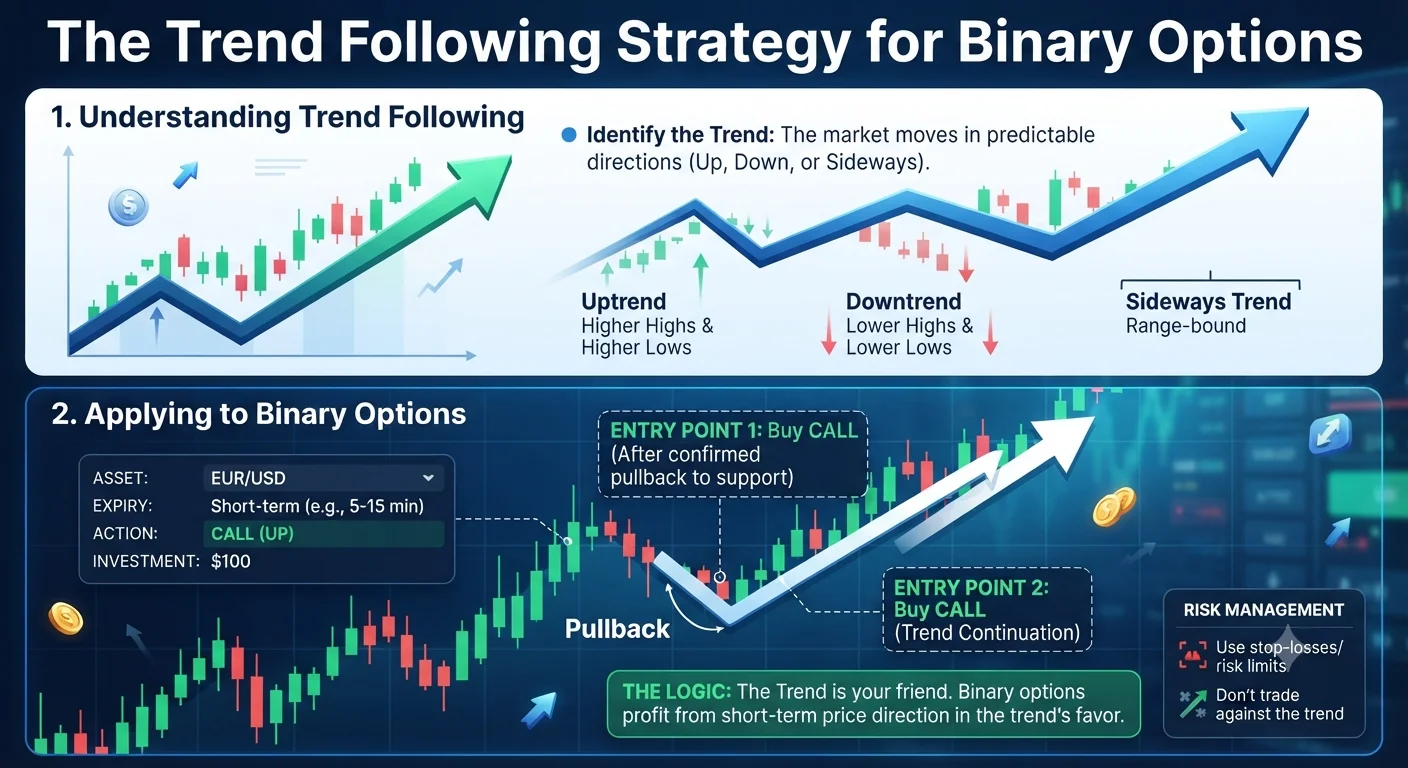
- What Is the Trend Following Strategy and How to Apply It to Binary Options Trades
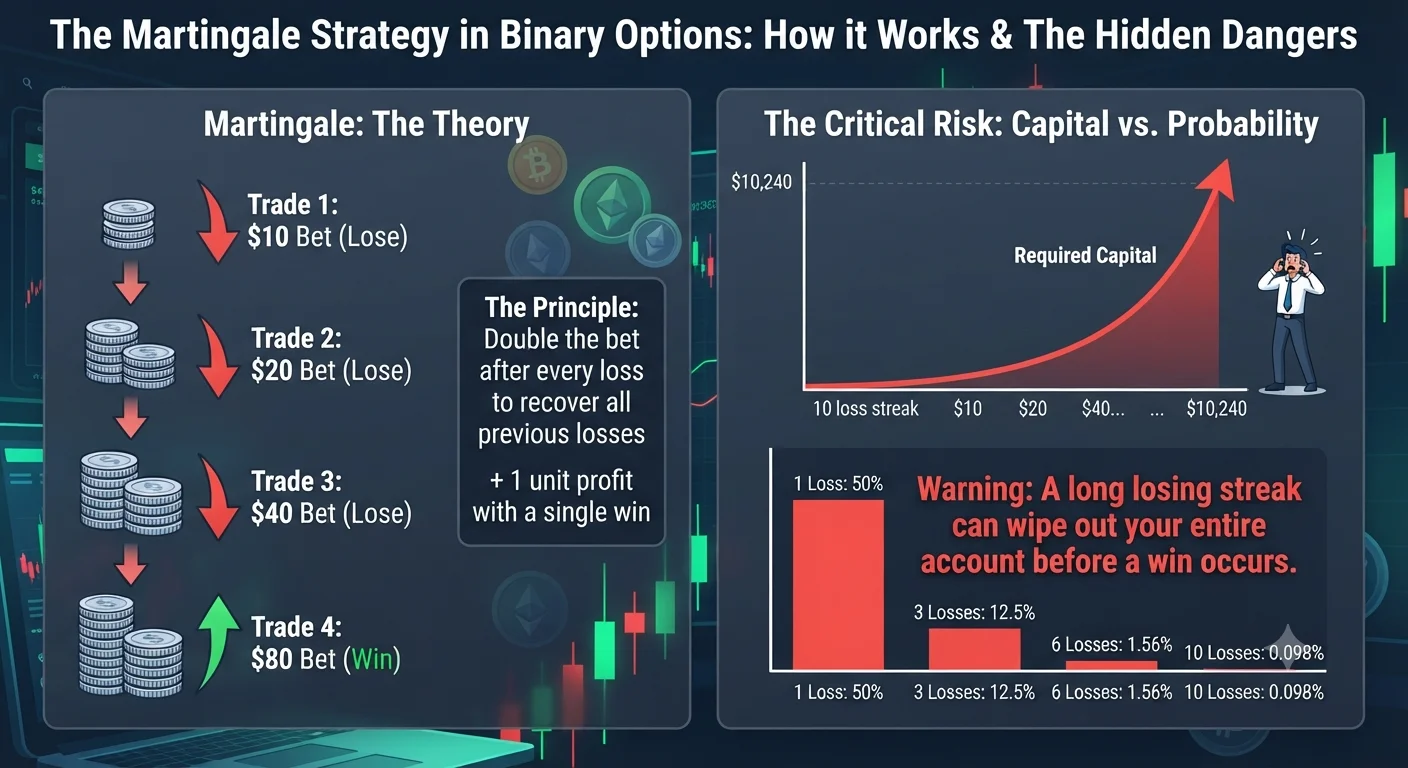
- What Is the Martingale Strategy in Binary Options and Should You Use It
This simple observation provides an immediately visible trend direction indicator directly on your price chart without requiring additional calculations or separate indicator panels beyond the moving average line itself.
The Moving Average Crossover Signal
One of the most commonly used moving average signals involves plotting two moving averages of different lengths simultaneously such as a shorter period and a longer period average. When the shorter period average crosses above the longer period average this crossover is generally considered a bullish signal suggesting upward momentum may be building. When the shorter period average crosses below the longer period average this is generally considered a bearish signal.
Many traders use these crossover events as entry triggers for call options on bullish crossovers and put options on bearish crossovers when combined with additional confirmation from other tools.
Using Moving Averages as Dynamic Support and Resistance
Beyond trend identification moving averages often function as dynamic support and resistance levels since price frequently bounces off or finds support near these lines during trending market conditions. In an uptrend price often pulls back toward a moving average before resuming the upward move which creates potential entry opportunities for traders watching this behavior.
This dynamic support role means moving averages serve a dual purpose in analysis providing both trend direction information and potential entry reference points simultaneously.
Recommended Articles
 STRATEGIES
 STRATEGIES
 STRATEGIES
 STRATEGIES
Common Moving Average Period Settings
The most commonly referenced period settings include the twenty period average for short term trend analysis the fifty period average for medium term trend direction and the two hundred period average for longer term overall trend context. These are not universal rules and different period settings work better for different assets and time frames though these specific values are widely watched by large numbers of traders which contributes to their self reinforcing relevance.
Beginners often start with the twenty and fifty period combination for their primary analysis before exploring other settings as their experience grows.
Limitations of Moving Averages
Moving averages are lagging indicators meaning they are based on past price data and therefore confirm trends that have already begun rather than predicting them in advance. This lag means moving average signals sometimes arrive after the most favorable entry point within a move has already passed.
During choppy sideways markets moving average crossovers can generate frequent false signals as price oscillates around the average without establishing a clear directional trend. This is why combining moving averages with trend confirmation and avoiding their use during clearly sideways market conditions generally improves results.
How to Combine Moving Averages With Other Tools
Moving averages work most effectively when combined with additional confirmation tools rather than used in isolation. Pairing moving average crossovers or dynamic support bounce observations with candlestick pattern confirmation such as a pin bar or engulfing pattern at the moving average level adds an important additional quality filter before committing to any individual trade.
Frequently Asked Questions About Moving Averages
What is the difference between a simple and exponential moving average A simple moving average weights all past periods equally while an exponential moving average gives more weight to recent price data making it slightly more responsive to recent price changes.
What does it mean when price crosses above a moving average Price crossing above a moving average generally supports a shift toward upward momentum though this signal is most reliable when combined with additional confirmation rather than used as a standalone entry trigger.
Can moving averages predict future price direction No. Moving averages are lagging indicators based on past price data that confirm existing trends rather than predicting future direction with certainty.
What period settings work best for binary options trading This varies by asset and time frame though the twenty and fifty period settings are widely used starting points that many traders begin with before adjusting based on personal observation and experience.
Should I use moving averages during sideways markets Moving averages generate more false signals during choppy sideways market conditions and are generally more effective during clearly trending market environments.
With a solid strategy toolkit now built continue strengthening your platform knowledge. Continue reading our guide on How to Deposit Money on Binary Options Platforms Without Fees or Problems.
This article is for educational purposes only and does not constitute financial advice. Trading involves risk and you should only invest money you can afford to lose.