MACD is another widely used momentum indicator that helps traders identify potential changes in trend direction and momentum strength. While it looks slightly more complex than RSI at first glance the core concept is straightforward once explained clearly.
This guide breaks down exactly what MACD means and how beginners can apply it to their trading decisions.
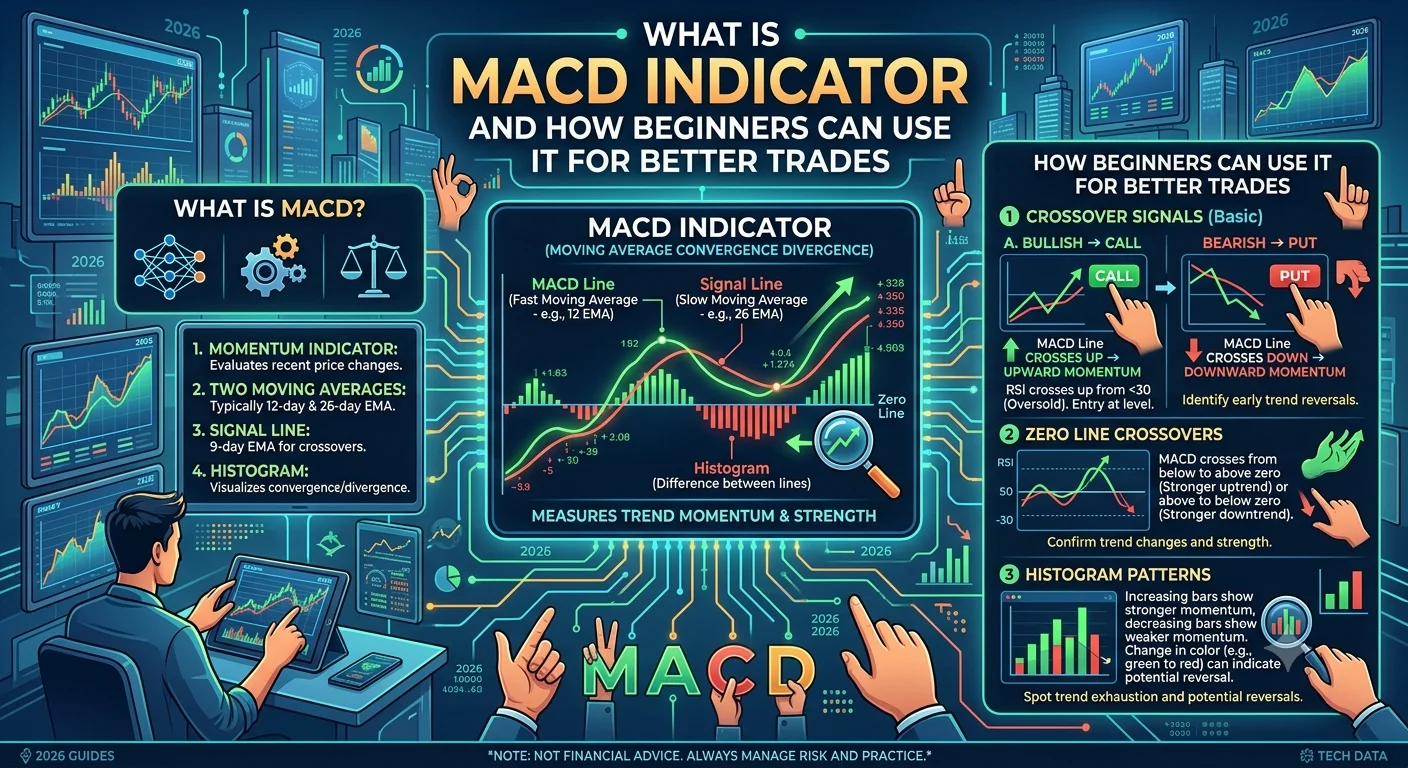
What Is MACD
MACD stands for Moving Average Convergence Divergence. It is a momentum indicator that shows the relationship between two moving averages of an asset's price helping traders identify shifts in momentum and potential trend changes.
MACD is displayed below your main price chart and typically includes three components. The MACD line which represents the difference between two moving averages. The signal line which is a smoothed average of the MACD line itself. The histogram which visually represents the distance between the MACD line and the signal line.
How MACD Helps Identify Momentum Shifts
When the MACD line crosses above the signal line this is generally considered a bullish signal suggesting upward momentum may be building which some traders interpret as support for considering a call option.
When the MACD line crosses below the signal line this is generally considered a bearish signal suggesting downward momentum may be building which some traders interpret as support for considering a put option.
These crossover points are among the most commonly watched signals among traders using MACD as part of their analysis.
Understanding the MACD Histogram
The histogram displayed alongside the MACD line provides a visual representation of how far apart the MACD line and signal line currently are. When the histogram bars are growing taller this suggests momentum is strengthening in the current direction. When the histogram bars are shrinking this suggests momentum may be weakening which could precede a potential reversal or crossover.
Watching the histogram alongside the actual line crossovers provides additional context about the strength and conviction behind a potential signal rather than relying on the crossover alone.
Why MACD Works Well for Trend Confirmation
MACD is particularly useful for confirming whether an established trend still has strong underlying momentum or whether that momentum may be fading. This makes it a valuable complementary tool alongside basic trend identification since it adds an additional layer of confirmation beyond simply observing price direction alone.
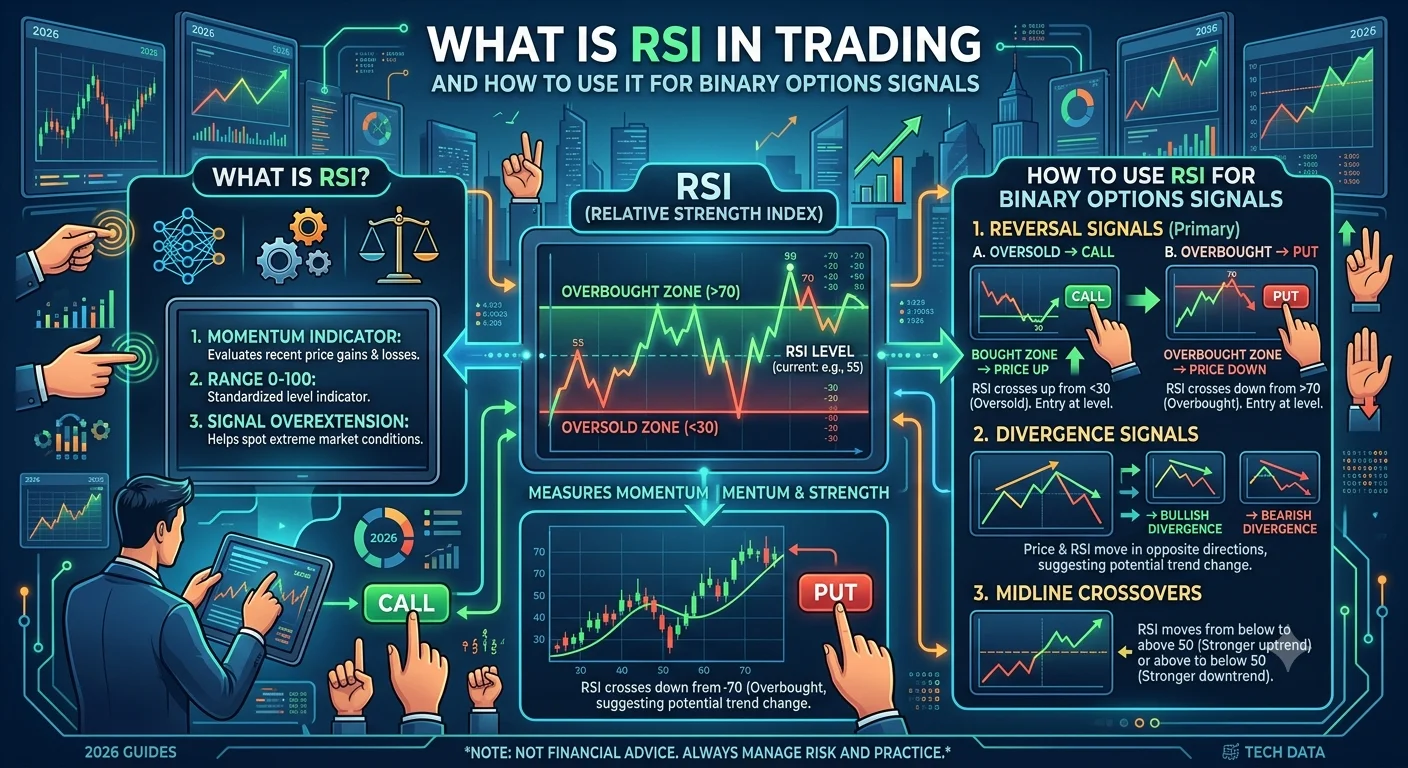
- What Is RSI in Trading and How to Use It for Binary Options Signals
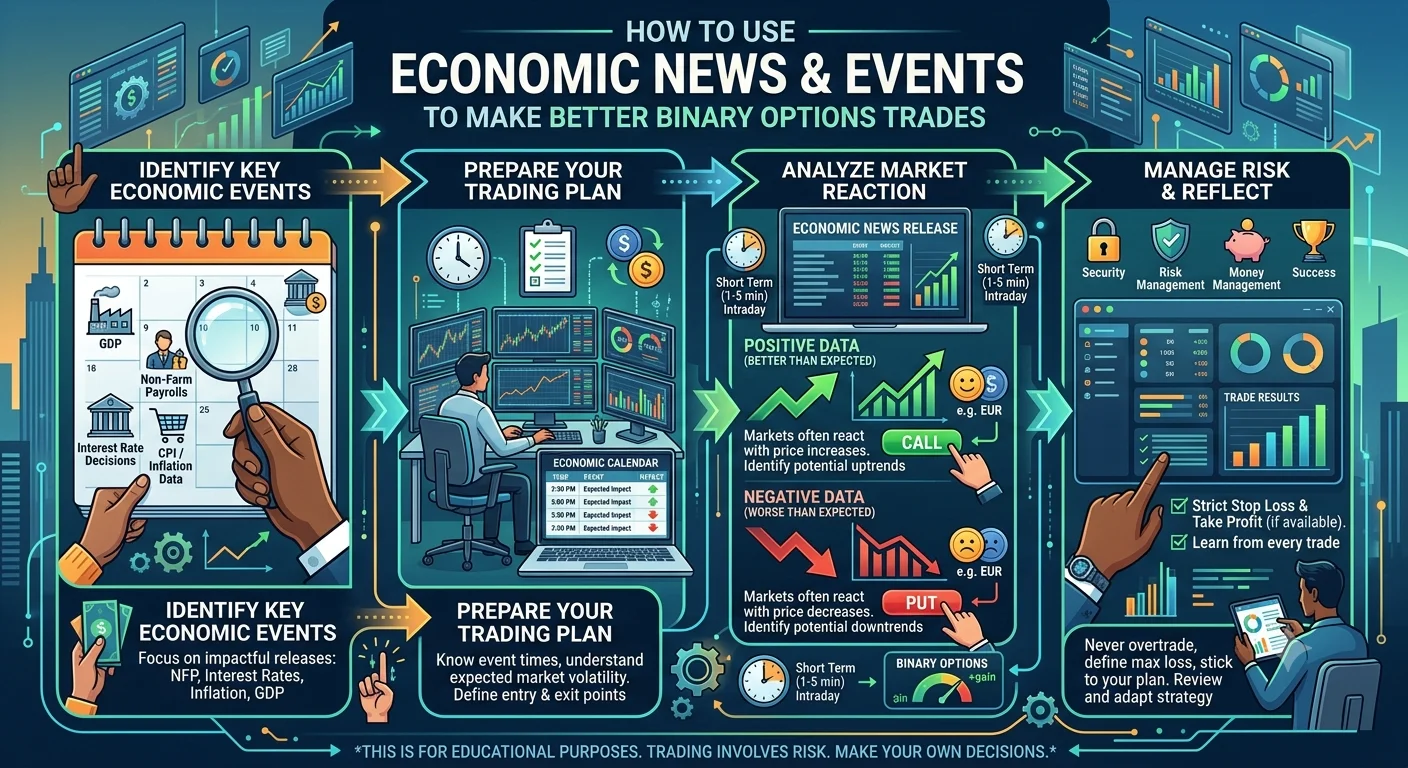
- How to Use Economic News and Events to Make Better Binary Options Trades
- Best Free Binary Options Trading Signals Tools and Apps in 2026
Many traders use MACD specifically to avoid entering trades too late in an already extended trend by watching for signs of weakening momentum through the histogram before committing to a new position.
Combining MACD With Other Technical Analysis Tools
MACD signals often carry more weight when they align with support and resistance levels or specific candlestick patterns. For example a bullish MACD crossover occurring near a strong support level provides more combined evidence for a potential call option than the MACD signal alone would provide in isolation.
Recommended Articles
 STRATEGIES
 STRATEGIES
 STRATEGIES
 STRATEGIES
This principle of combining multiple confirming signals rather than relying on any single indicator is a common theme throughout effective technical analysis regardless of which specific tools you choose to use.
Common Mistakes Beginners Make With MACD
One common mistake is treating every single MACD crossover as an automatic trading signal without considering the broader market context or combining it with other forms of confirmation. Another common mistake is using MACD on extremely short time frames where frequent crossovers can occur rapidly creating excessive and sometimes conflicting signals.
Beginners should also be aware that like most indicators MACD is based on past price data and can sometimes generate delayed signals particularly during fast moving or highly volatile market conditions.
How to Practice Using MACD Effectively
Spend time on a demo account specifically observing how MACD behaves during different market conditions including strong trends sideways consolidation periods and reversal points. This practice helps you develop an intuitive understanding of how reliable MACD signals tend to be for your specific chosen assets and expiry times before applying this tool to live trading decisions.
Keep notes in your trading journal about MACD signals you observed and whether the resulting price movement matched your expectations to help refine your understanding over time.
Frequently Asked Questions About MACD
What does MACD stand for MACD stands for Moving Average Convergence Divergence. It is a momentum indicator used to identify potential shifts in trend direction and momentum strength.
What does it mean when the MACD line crosses above the signal line This crossover is generally considered a bullish signal suggesting upward momentum may be building though it should be combined with other analysis for confirmation.
Is MACD better than RSI for binary options trading Neither indicator is inherently better since they measure slightly different aspects of momentum. Many traders use both together for more comprehensive confirmation before placing a trade.
Can MACD signals be delayed Yes. Like most indicators based on historical price data MACD signals can sometimes lag behind actual price movement particularly during fast moving or highly volatile conditions.
Should I use MACD alone to make trading decisions No. MACD works best when combined with other tools such as trend analysis support and resistance levels or candlestick pattern confirmation rather than being used in isolation.
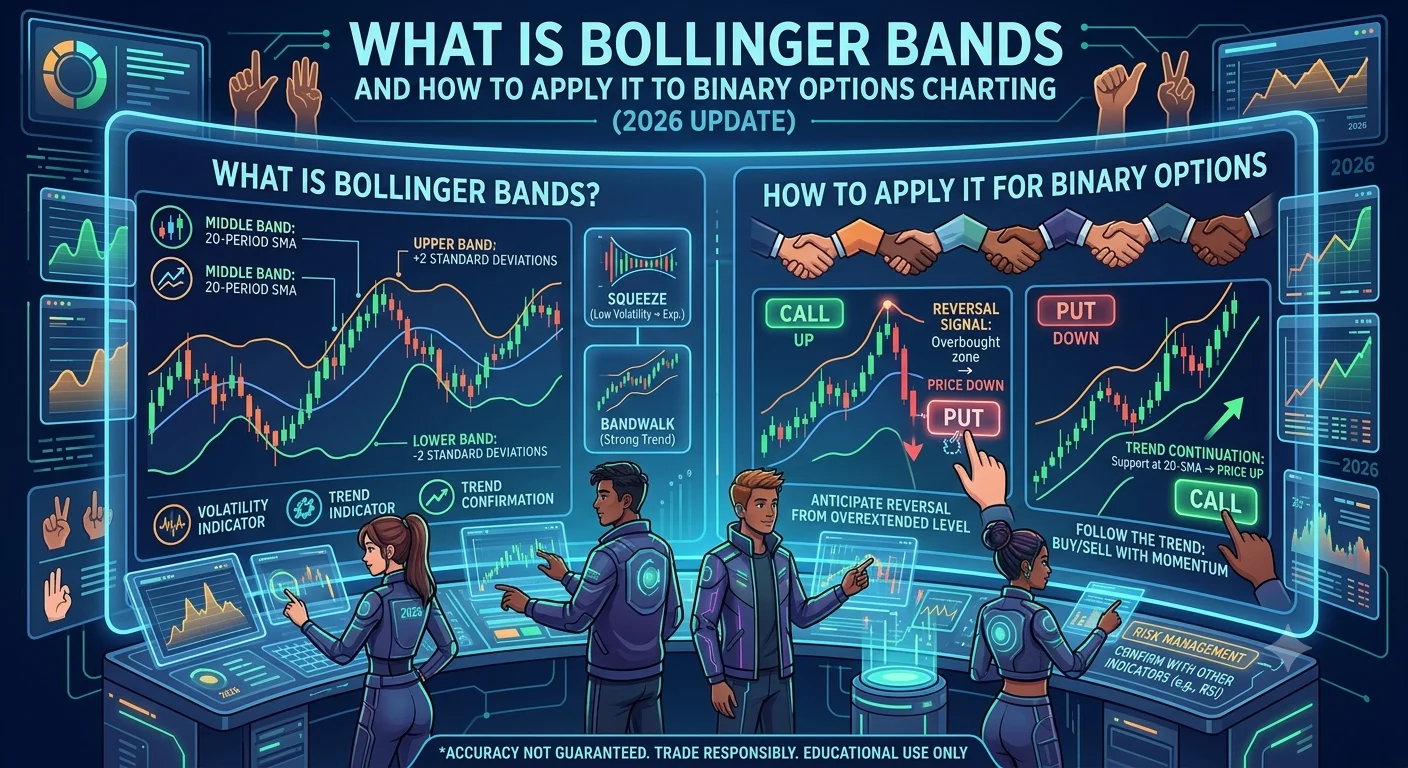
Understanding volatility based indicators rounds out your technical analysis toolkit further. Continue learning with our guide explaining what Bollinger Bands are and how to apply them to binary options charting.
This article is for educational purposes only and does not constitute financial advice. Trading involves risk and you should only invest money you can afford to lose.